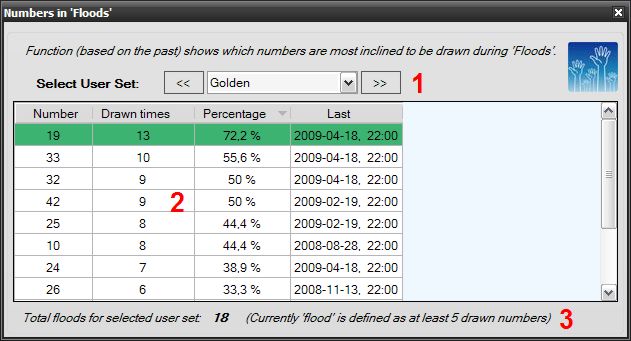
This function provides information about the frequency of numbers (from
selected groups), which were drawn in flood-like draws. Generally some sets of numbers are more
frequently drawn together than others.
By default all draws are analyzed.

1 - Select the User Set from the list. (It's defined in 'My numbers' function).
2 - The result table contains:
- "Number" - a number from selected user group
- "Drawn Times" - shows how many times a number was drawn in all floods
- "Percentage" - shows 'drawn times' expressed as percentage of all floods
- "Last" - indicates the date of the last flood that contained this number
3 - Short info about the total number of floods for the selected group.
It also gives Keniox’s current definition of "flood" .