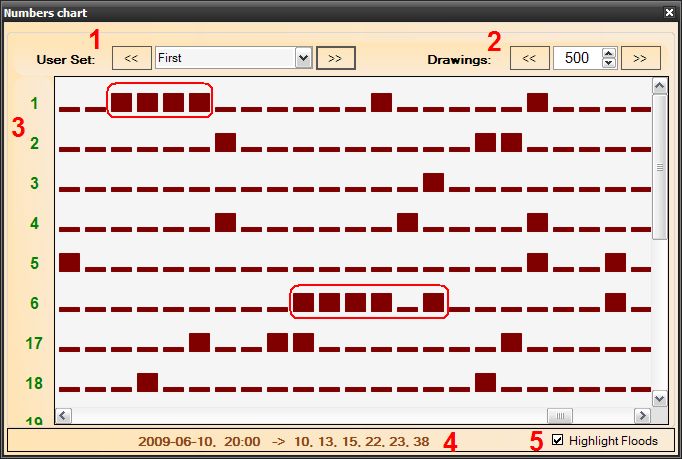
This chart helps to see whether a particular number is 'on the wave' or has not come
up for many draws (it is 'cold'). A little red square indicates that the particular number has been
drawn and the line indicates that it hasn't. We can see here how the numbers behave over time;
is a number regular (drawn from time to time) or is it often a member of a 'wave'.
Basically a player is able to recognize if it's a good time to fill the ticket or not yet.
Below we can see the numbers that were drawn (or not) in June 2009 -> Lottery: Quebec 49 (Canada).

1 - Choose the User Set from the list.
2 - Select the number of last draws to display.
3 - It's a list of selected group's numbers.
4 - By clicking on any square/line in the chart area - you can see the date of the draw and its results.
5 - Tick the box to highlight the draw (see below) when a 'flood' occurred in the selected group.
In the rounded rectangles we can see the 'wave' of numbers: 1 and 6.
These ones have a tendency to be drawn in each consecutive draw.
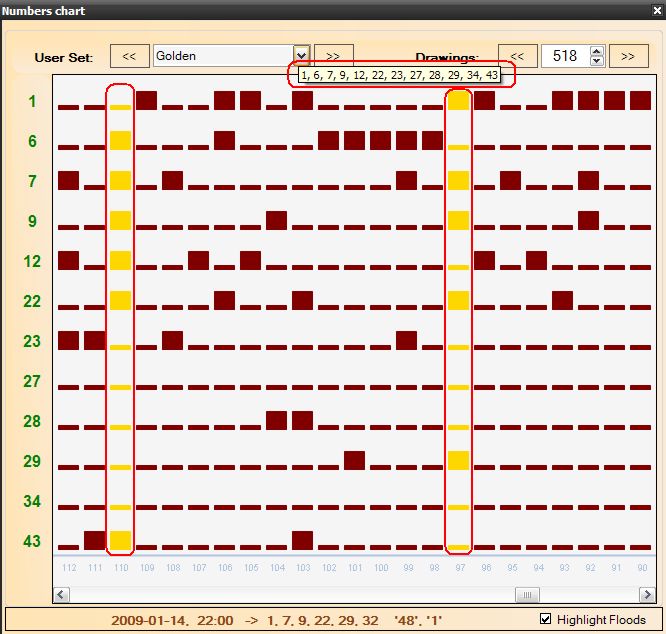
Highlighted floods
The red rectangles mark 'floods' (on the left: six numbers, on the right: five).
What’s interesting here is the behavior of number: '6'. After a huge 5-draws wave, it stopped coming up,
just before the flood.
TIP: The horizontal rectangle contains the tooltip that appears after hovering
with the mouse over the selected user set, displaying all its numbers.

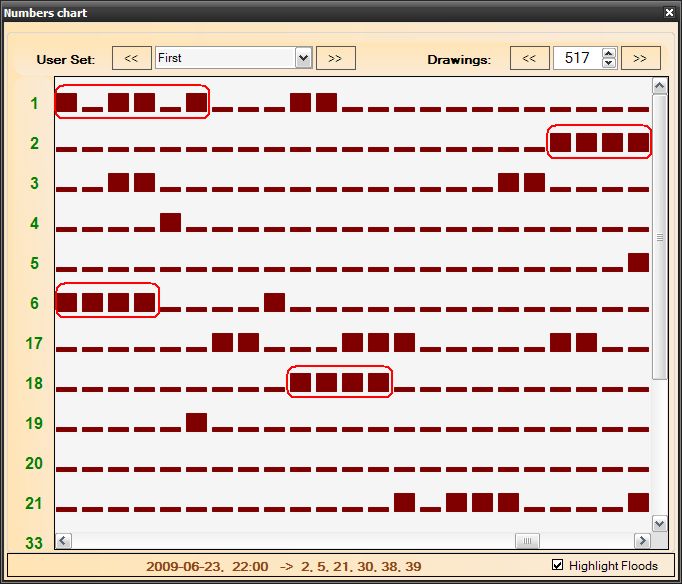
Another example

As shown above, numbers 1, 2, 6 and 18 have caught up as they were far behind the rest.